How to debug an MSBuild build process when building Orchard Core - Orchard Core Nuggets
Build processes of .NET Core apps like Orchard Core are getting quite complex nowadays, and the MSBuild build pipeline also commonly includes steps for building client-side resources or doing a lot of things out of the .NET world. What can you do if something goes off course with all those targets and props files and you're just scratching your head? How to figure out what happens during the build if you can only see that the results are incorrect?
-
When publishing a .NET Core app or running a build directly use the MSBuild switch
/bl. This will create a binary log that exposes a lot of the internal info of the build process. You can pass such build parameters todotnet publishtoo. -
Open the binary log with MSBuild Structured Log Viewer.
The tool will show you how exactly the build process runs, what the order of the steps is, how long everything takes… You’ll even be able to see the values of all variables!
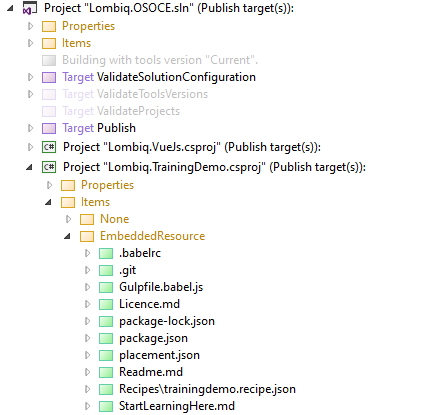
If you want to check out what was actually included in the assembly, including static resources being embedded, then you can use ILSpy to decompile it. It’s also available as a handy Visual Studio extension.
Oh, and BTW if you want to add NPM and Gulp operations to the build pipeline check out our open-source NPM MSBuild Targets project!
Did you like this post? It's part of our Orchard Core Nuggets series where we answer common Orchard questions, be it about user-facing features or developer-level issues. Check out the other posts for more such bite-sized Orchard Core tips and let us know if you have another question!